
How much fuel's in your trade?
It's a see-sawing act of using fuel and refuelling. Using up fuel and refuelling.
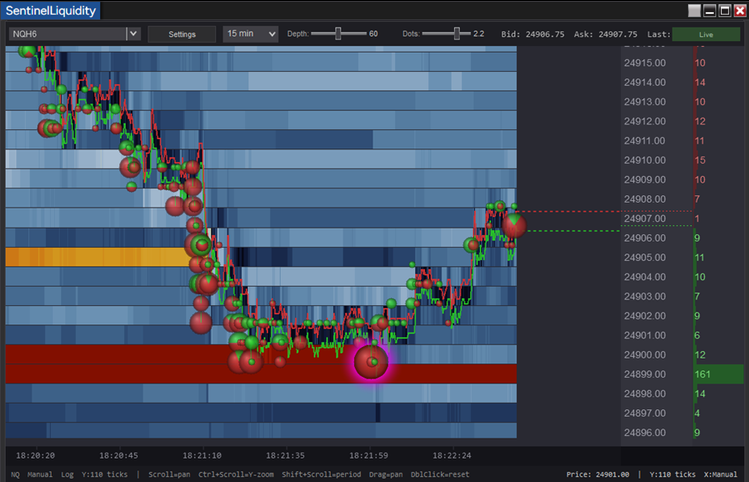
The screenshot below of SentinelLiquidity shows cascading red bubbles dropping vertically. The ratio of red to green shows you sellers are urgently hitting the bid.
But then the selling runs into a brick wall. The selling bubble with the magenta glow around it (that's a visual cue for a large trade) is the final exhaustion of selling.
Once the market reached the orders for over 300 lots (the two red horizontal bars) there wasn't enough selling fuel to fill the lower order. You can see it's still sitting there - the buy order of 161 lots. The selling fuel has been used up (in the short term).
Why the map?
I can recognise 'fuel' being used up on a footprint chart when trading 6A.
But in mid-2025 I started preparing for a regime change.
By Q4 last year the Nasdaq was making significant moves during Asian hours. So I started the preliminary steps to trading it.
First look at the DOM and the footprint? 'F me!' Couldn't make any sense out of it.
But trading is problem-solving. The solution is the Aggregated/StaticDOM I've previously illustrated, the SentinelLiquidity and some other custom tools not covered.
Monitoring bids and offers at every .25 increment while keeping abreast of everything else. Way too hard. But with the aggregation, it's not a concern.
The trades
On the chart below, of interest is how those orders align with our proprietary intel - the Pre-Pro Low™️ Last article mentioned there are universal points of evidence most traders aren't aware of (if everyone knows about it - it doesn't work)
A rule of thumb is if price drops aggressively odds are higher than 87% price will pause and make at a minimum a small reversal.
It's that 'at minimum' I used to take quick profits to pay for the trade, so if it then rolls over those profits offset a loss.
But you never just leave a limit order in. This is a multiple-points-of-evidence business...always.
Those who don't abide by that get punished. Think of it as picking up pennies in front of a steamroller.
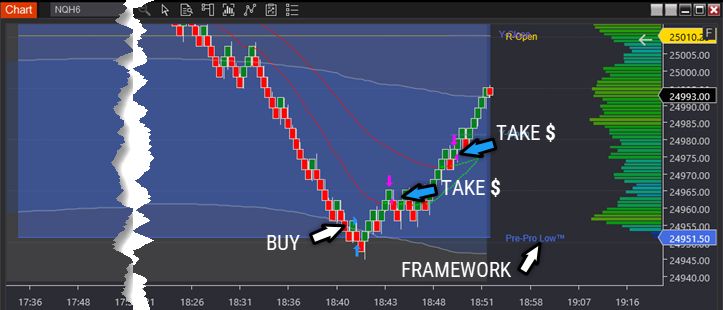
The trade above is just one example of a repeatable framework that you apply to different markets.
But years of execution intraday in 6A versus weeks in NQ means I've got a way to go, as my reviews highlight:
Leaving too much on the table.
Giving back more than I should (you'll see me give back over 20 points in a moment on part of the position).
It's an adjustment period like you change from juggling tennis balls to baseballs.
Yet a unique current feature is the extreme volatility. I'm still capturing some absurdly large moves - just by implementing my framework and playbook.
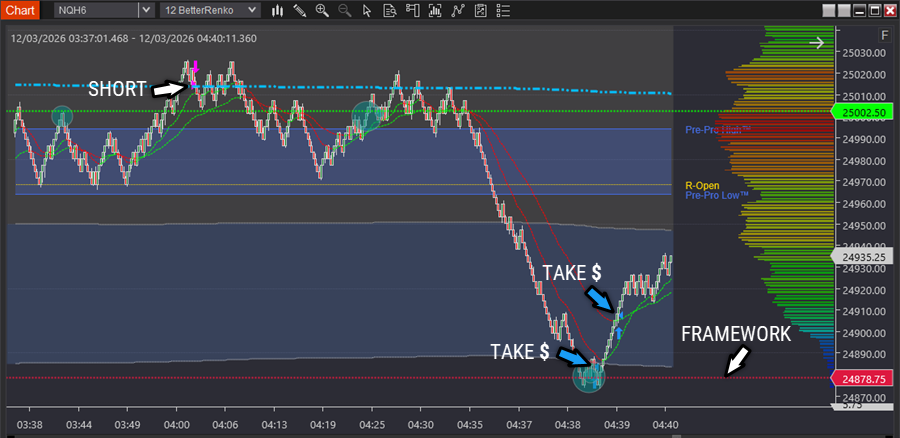
Below is a 100-point intra-day trade in NQ when the steamroller paid a visit. The amount of fuel available for this massive price drop is what made it possible.
I'm not vulnerable to blowouts, blow-ups, or revenge trading. The daily repetition of the framework is why.
As Dr Brett Steenbarger says: "We learn great trading psychology when we learn to trade greatly."
The framework handles the psychology. Which means when volatility like this shows up, it's not something to avoid. You want to dive right in.
The greater the volatility, the greater the seesaw. Fuel running out, refuelling, running out again. It's opportunity when you recognise what's taking place.
Trading frustration is often a sign what's been working is no longer working.
But that's not a framework failing. That's the absence of one.
Markets have changed. But they've changed before. And they'll change again.
What matters is having a framework where you're able to play a game many others can't — because the thinner the competition, the better the reward.